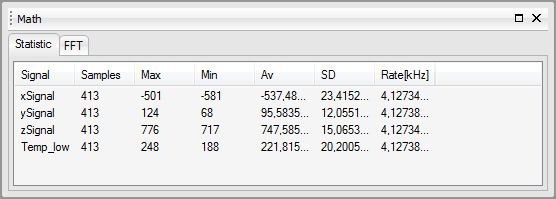
Display statistics of the individual sensor signals.
In the first register it is displayed as numbers:
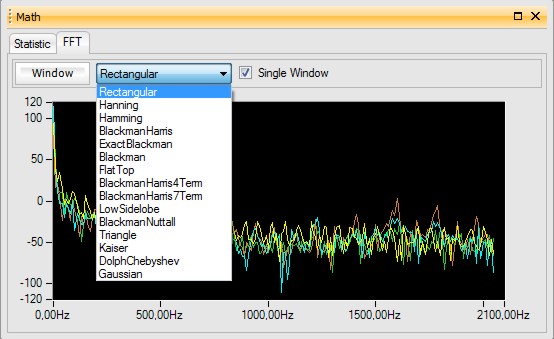
In the following register it is displayed as a graphic based on the different models.